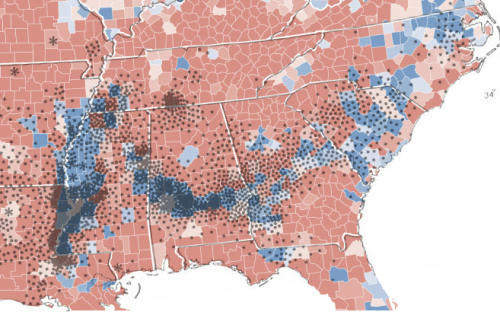
This map shows a strong correlation between 2008 presidential election results (red counties = McCain, blue = Obama) and cotton production in 1860 (each dot = 2,000 bales).
Long story short:
- Marine deposits from Upper Cretaceous period form Selma Chalk, which underlies the area in the crescent through Mississippi and Alabama.
- That area, and other soils suitable for cotton production, attract plantation owners who concentrate slave labor on the most productive soils growing the most lucrative cash crop, King Cotton.
- Despite migrations after emancipation, the areas where cotton was king continue to have a large proportion of African-Americans.
- African-Americans voted overwhelmingly for Obama, producing the blue streak through the otherwise red south.
This correlation was first noted on by Allen Gathman. a genetics professor at Southeast Missouri State University, with further elaboration at The Vigorous North and Strange Maps.


so interesting…am forwarding to friends and family from the south…I am sure they will find it interesting too.
The scientist in me thinks this post is pretty cool. According to my teenager, the aging boomer in me should find another descriptive to use.
Thanks — just my kind of strange trivia.
Very interesting! I love maps and how things relate to each other.